Model
Gaining meaningful insight from data is the cornerstone of self-service analytics. With statistical modelling, Analytics is able to approximate reality from a loaded index and display the results using a range of visualisations as a fully interactive Bayesian network or decision tree.
To access the Model functionality, click Model on the Menu links panel at the top of the screen.
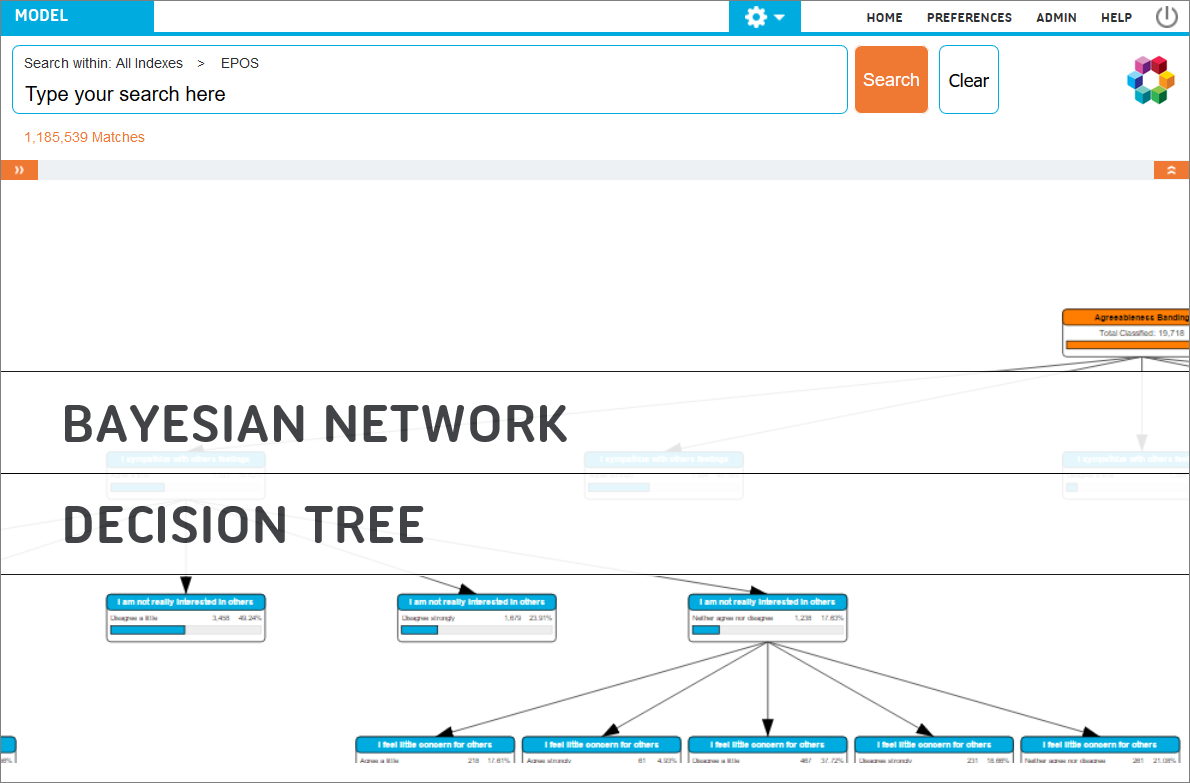
- A Bayesian Network is a graphical model that denotes probabilities of the possible outcomes of events and how they are conditionally linked. The structure of a Bayesian network consists of individual nodes that represent a belief about a particular event and arrows to denote the nodes that are probabilistically linked. This is to provide an understanding of the system that is being modelled, allowing predictions to be made about how the system will behave in the future.
- The Decision Tree functionality uses the C4.5 algorithm to calculate the nodes that are most influential on a field of interest to predict the value of the chosen field. The model is displayed with decisions and their subsequent consequences as a graph that will display outcomes as variables are selected, allowing users to pinpoint the variables that have a specific effect on an outcome.