Options
Inverting a Query
Once a search has been performed, you can use this option to quickly perform the exact opposite search, the equivalent of including a NOT in front of the search term.
- To invert the current search, click the cog
 icon and select Invert Query. The query bar will have a red border when this option is active.
 -
To turn off the inverted search, click the cog
icon and select the Undo Invert Query option.
Adding Results to a Query
To add a value displayed in the results panel to the current query, click it. The search will be automatically executed, allowing rapid filtering of large datasets.
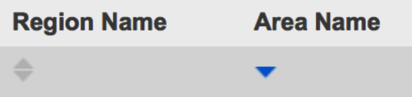
Sorting Data
If enabled by the administrator, it is possible to sort the Query screen results using any available column. Click the arrows below the column heading and choose between A-Z, Z-A or No Sort.
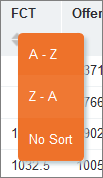
The arrows will turn blue and highlight the sorting direction once a selection has been made.
Selecting Unique Column Values
To select one or more unique values from a column, first click the relevant column label. This will display a dialog box containing the unique column values.
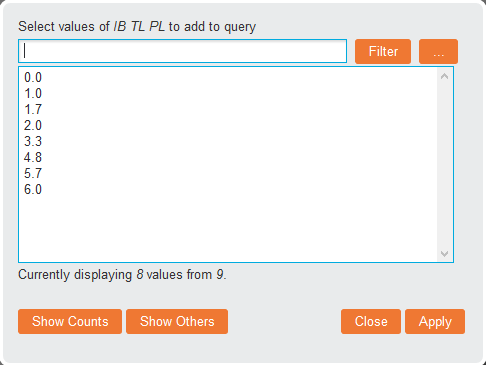
Click the ellipsis (…) button to manually enter values or select the required values from the list and click the Apply button to complete the process.
To display the record count for each unique value, click the Show Counts button. If the current search or filter restricts the values that are displayed in the unique column count, click Show Others to display all values restricted by the search.
Note: The search terms are case sensitive and cannot contain wildcards.
External Query Links
Analytics can provide links from data in the results panel to other applications. If external query links have been enabled by the administrator, an Open button will be linked to each row of data in the results panel.
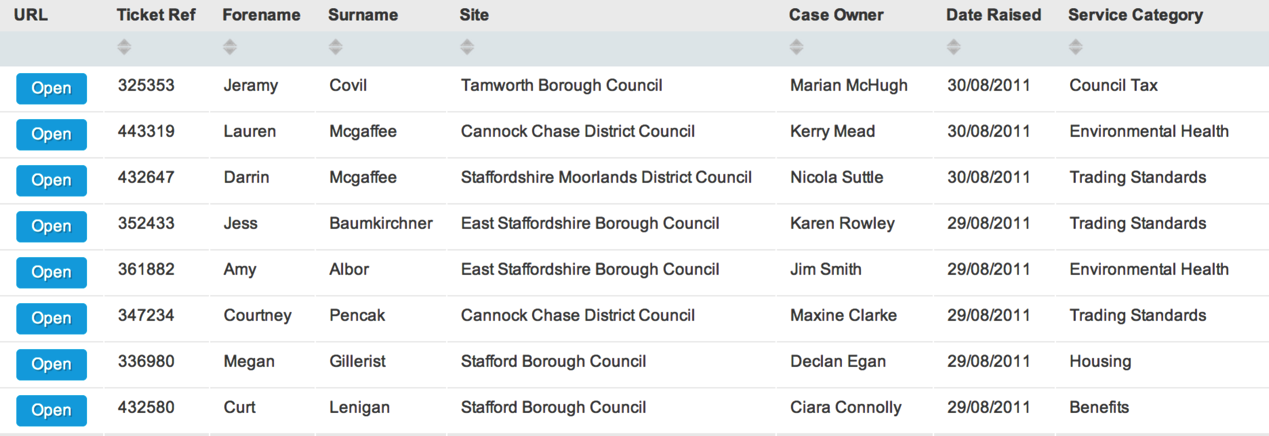
Click this button to open the external application based on the row of data selected.
Display Fields
To add, remove or change the order of the columns displayed in the table view, click the cog ![]() icon and select Display Fields.
icon and select Display Fields.
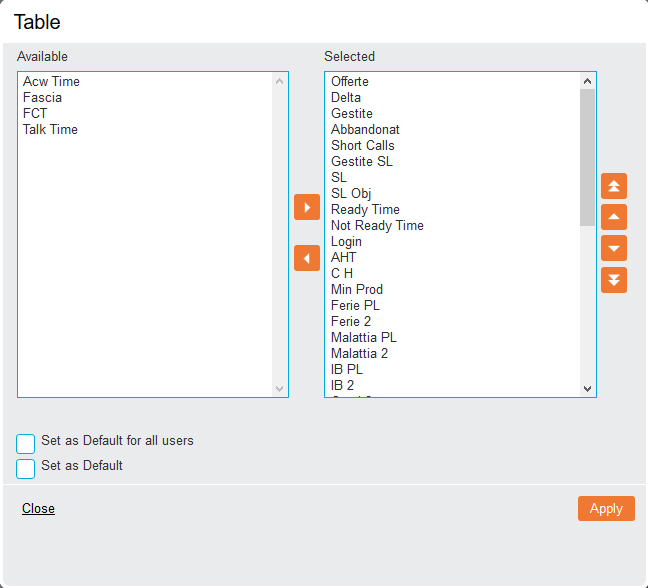
Move fields between the 'Available' and 'Selected' boxes using the left and right arrows and use the up and down arrows to order the selected fields.
Click the Set as Default checkbox to save the display options as a default setting. Click Apply to save any changes or Close to discard them.
To reset any changes to your display fields back to your default view click the cog ![]() icon and select Reset Display Fields.
icon and select Reset Display Fields.
Editing Index Components
As an administrator user, these options allow fast access to each index component in the admin area. Click the cog ![]() icon to access the Edit Search Engine, Edit Index, Edit Data Source Group and Edit Data Source options. The Build Data Source Group option builds the current Data Source without having to navigate to the admin area.
icon to access the Edit Search Engine, Edit Index, Edit Data Source Group and Edit Data Source options. The Build Data Source Group option builds the current Data Source without having to navigate to the admin area.
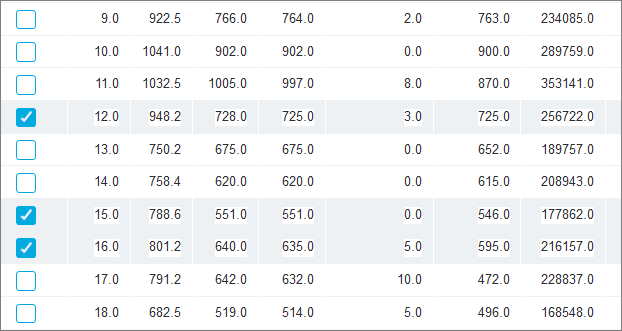
Selecting Rows
This option adds a checkbox on the left of each row to allow easier viewing of records when scrolling horizontally.
- To select rows, click the cog icon and select Show Row Select Options.
- To hide these checkboxes click the cog icon and select Hide Row Select Options.
Index User Preferences
To access the user preferences for the currently loaded Index click the cog ![]() icon and select Index <Index Name> Preferences.
icon and select Index <Index Name> Preferences.
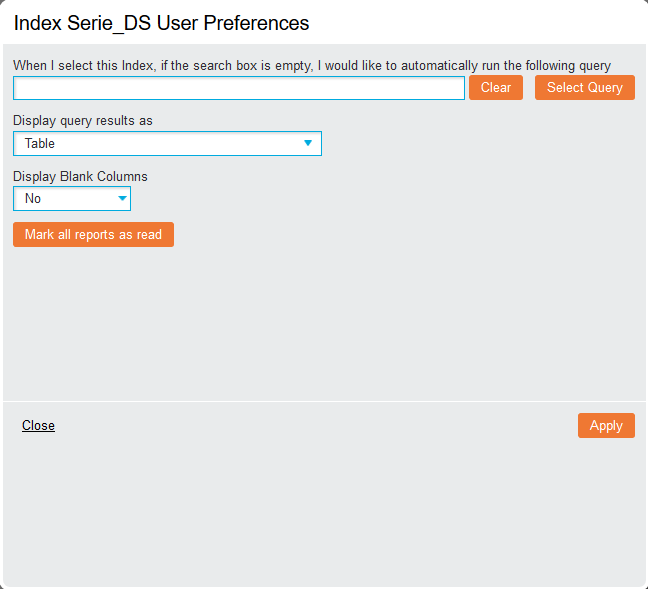
- To automatically run a search term when the Index is selected and the query bar is empty, enter the required term in the top textbox. Alternatively, click the Select Query button to load a saved query.
- Use the Display Query Results drop-down list to specify the default Query Layout.
- Specify whether to display columns that do not contain any values using the Display Blank Columns drop-down list.
- Click the Mark All Reports as Read button to mark all new reports as read for the Index.
There are a number of different layout options for the results panel in the Query screen. Their availability is configured by the administrator.
- Table: The default layout, displaying rows of data in the style of a worksheet.
-
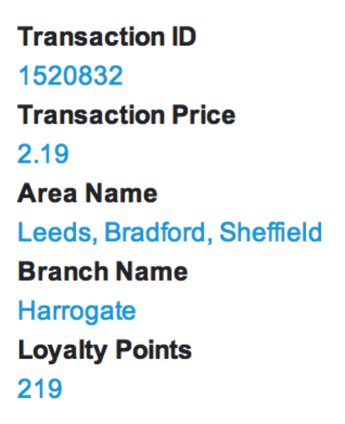
List: Displays a summary of the data in a list format.

-
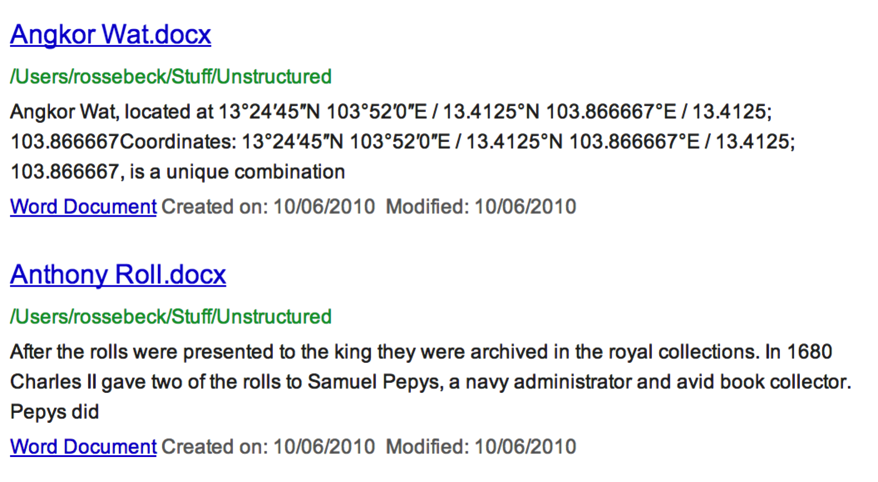
Unstructured: Used for indexes containing unstructured data such as documents, this view allows users to see the text in a view of wrapped paragraphs with header and title information similar to a table structure. This view will recommend other search terms based on the term entered into the query bar.
-
Fixed List: Another view for unstructured data, this view provides a web-style search results summary and will display each section in a uniformed structure.

-
HTML: Displays data using HTML formatting.
-
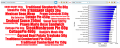
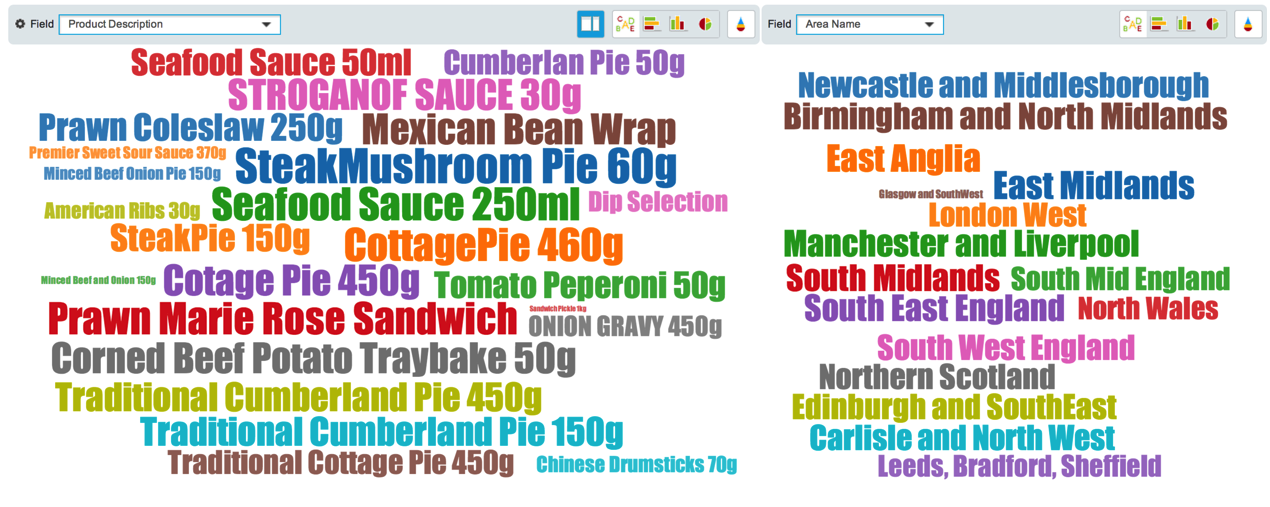
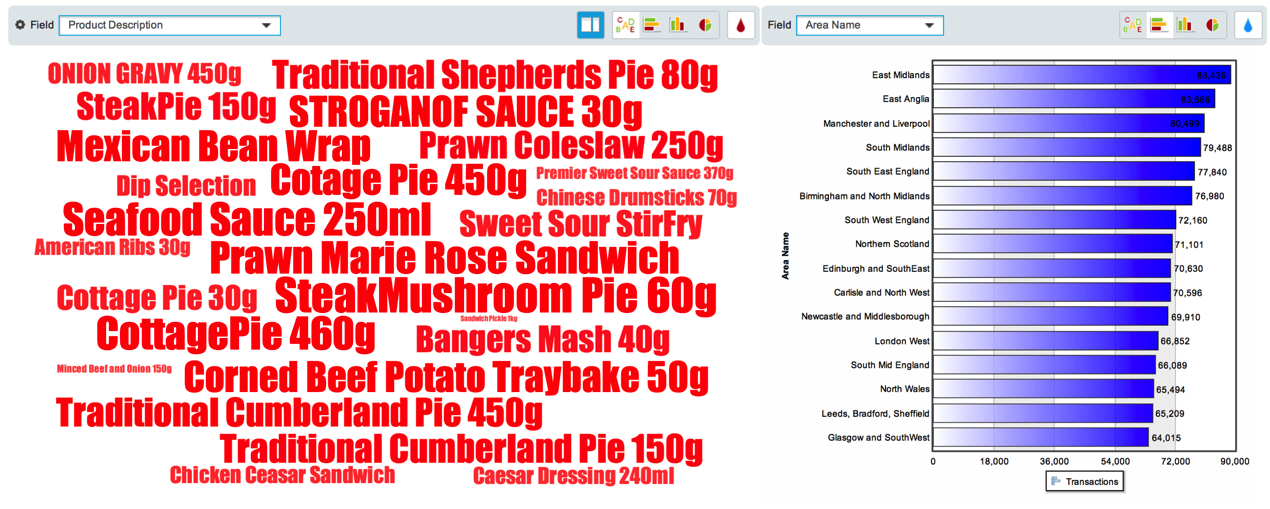
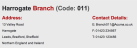
Word Cloud: Displays the data as a series of words, with the size of each word representing the relative amount of records for each value.
Above the word cloud is a control panel. This provides you with options to change the way the word cloud looks and behaves.

To change the field used in a word cloud window, select the required value from the Field drop-down list.
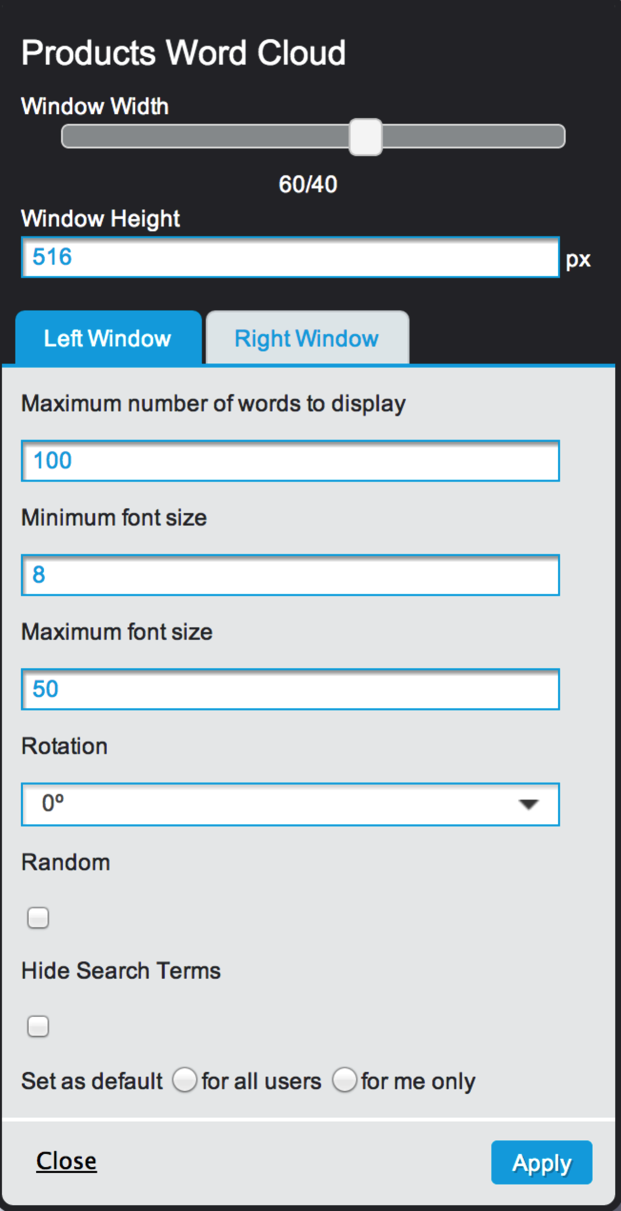
 Word Cloud Configuration
To alter the word cloud options, click the cog
icon in the control panel.
- Window Width (slider): The word cloud window view is divided into two windows by default. Use this option to adjust the size ratio. When set to the maximum, only a single word cloud is displayed.
- Window Height: The size of the display in pixels. To specify options for individual windows, use the 'Left Window' and 'Right Window' tabs.
-
Maximum number of words to display: The maximum number of words to display per page on the query screen.
Warning: If the 'Maximum Font Size' setting is too high, then the maximum number of words may not be rendered on screen.
- Minimum/Maximum font size: Customise the size range of the displayed text.
- Rotation (drop-down list): It provides the option to rotate the words by a specified angle in degrees.
- Random: Displays fields in random directions and positions rather than in uniformed directions.
- Percentage of Total: Enabling this sizes words based on a percentage of all data.
- Stop Words: Enabling this excludes the words configured by the system administrator.
- Hide search terms (checkbox): Check this to hide the contents of the query bar when viewing the word cloud
- Set as default (radio buttons): Set any changes as your default configuration,.
Click the Apply button to save changes or the Close button to discard them.
Word Cloud Customisation
To toggle between one and two windows, click the first icon of the panel:

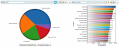
To change the chart type used by the Word Cloud layout, click the appropriate icon for Word Cloud, Bar Chart, Column Chart or Pie Chart.

To change the colour of the selected chart type, click the Colour Drop icon.

You can select from black, red, green, blue or multi-coloured.