Totals
In this tab, you can configure how the data is displayed using one or more different aggregations.
As well as counting the results, it is also possible to Sum, Average or leverage a wide range of mathematical functions on specific numeric fields.
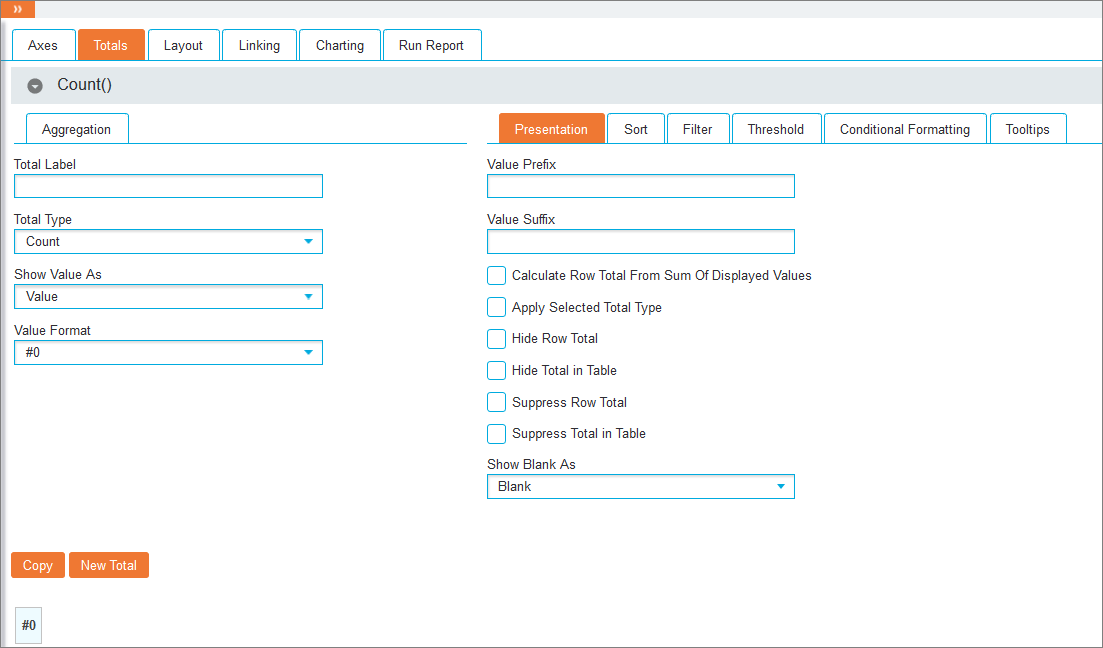
Aggregation tab
The following data can be provided:
-
Total Label: Enter a custom display name for the total. A label is not required when running a Crosstab with a single total, but can still be specified if a description of the values is required. If more than one Total is created, a default name in the following format will be generated:
<Total Type> (Measure)
-
Total Type (drop-down list): Select the total to be performed from a range of mathematical functions, which can be applied to any numerical fields on the Measure drop-down list. Numerical fields that can be used as a Measure are configured by the administrator.
Note: When using fields that have a numeric value as the starting character you will need to use speech marks (“) around the word, e.g. “4WeekTotal”.
 Total Type Mathematical functions
Function Description Count (default type) See the results returned by distinct/unique values. Row Total Add totals against rows not columns. Sum Display the results as a summed measure, such as the SUM of the cost of product. Average The average value of a selected measure. Minimum The minimum value of a selected measure. Maximum The maximum value of a selected measure. Median The middle number of all the values. This is calculated by placing the values in numeric order and using the central value. Mode The value that occurs the most within the measure. In the instance that more than one value occurs the most within the measure, the lower of the values is chosen. Standard Deviation The average of a series of averages. Calculation Calculations can be added in 2 ways as a Total Type or as a Measure. -
Measure (drop-down list): Selecting any Total Type except Count, Calculation or String Calculation activates this list for selecting the Index field to perform calculations on using the specified Total Type rather than a direct cell calculation.
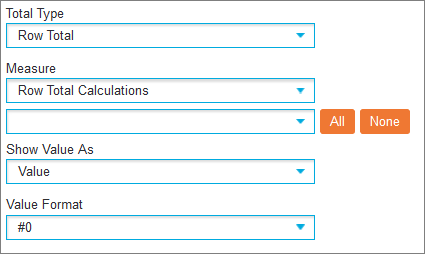
Measure for Row Total and Row Total Calculations types
Selecting one of these total types shows a second drop-down list in the Measure option, allowing the selection of specific rows for creating your Row Total against.

To select all rows, click the All button and to deselect any rows click the None button.
Available rows will be displayed with the following options:
Icon Description 
Click this icon to copy all formatting configuration from the Row Total above. 
Click this icon to configure the formatting of the Row Total. Use the Value Format drop-down list to select how the value will be displayed and the Value Prefix and Value Suffix fields to enter characters that will appear before or after the displayed value. The Tooltip textbox allows the entry of text that will appear when hovering the cursor over the selected value and the Show Value As drop-down list is used to display the value in relation to the other Row Totals. To close the options and apply the changes, click Close. 
Click this icon to set conditional formatting for the Row Total. For further details, please refer to the Presentation section of this page. After setting the required options, click Close to save any formatting options. 
Click this icon to set tooltips for the Row Total. Enter the required text in the Default Tooltip textbox for a single tooltip. Click New Tooltip to create multiple Aggregation Tooltips and specify the target Row Total with the Tooltip drop-down list and where it will be displayed using the Scope drop-down list. Click the X icon to remove a specific tooltip. Click Close to save the tooltip options for this Row Total. -
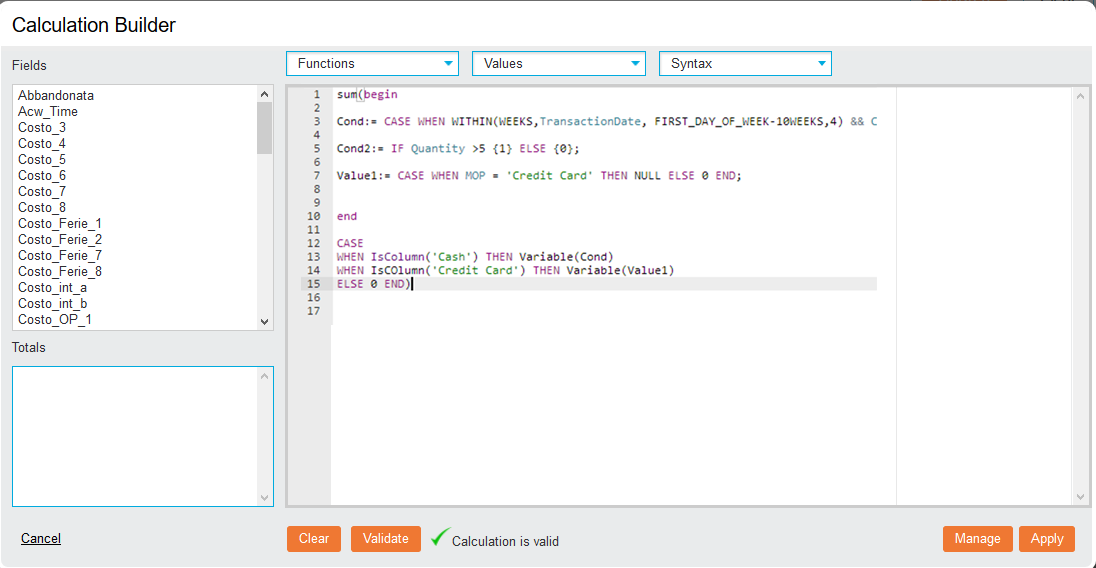
Calculation: Selecting Calculation or String Calculation as a Total Type activates this field for performing cell calculations based on existing totals or string calculations based on existing totals, as well as fields within the Index. Click the ellipsis (…) icon to access the Calculation Builder.

- Dynamic View (drop-down list): If the administrator has configured Dynamic Views for the Index, they will appear in this list. These can be used with any total type and any measures that they have been configured for or against a default count. This will result in a distinct count of the field in the Dynamic View.
-
Show Value As (drop-down list): Select how the value will be displayed
Options
Show Value As Description Value Displays the results as a number% of Row Total: Shows each value as a % of the row total % of Column Total Shows each value as a % of the Column total % of Grand Total Shows each value as a % of the Grand total % of Column Sub Total Shows each value as a % of the Columns Subtotal. The Subtotals themselves are a % of the Column grand total. Running Total Across Rows Shows a cumulative total value across the rows of your table Running Total Across Rows % of Row Total Shows a cumulative total value across the rows of your table as a percentage of the row total. Running Total Across Rows % of Grand Total Shows a cumulative total value across the rows of your table as a percentage of the grand total. Running Total Across Rows by Group Shows a cumulative total value across the rows of your table by group. Running Total Down Columns Shows a cumulative total value down the columns of your table Running Total Down Columns % of Column Total Shows a cumulative total value down the columns of your table as a % of column total: Running Total Down Columns % of Grand Total Shows a cumulative total value down the columns of your table as a % of grand total: Running Total Down Columns by Group Shows a cumulative total value down the columns of your table by group. Ratio Apply a ratio to your table data. Total Ratio As above except the ratio can be applied to overall grand total. Row Total Ratio This allows you to apply a ratio for the rows of your table.
Example: For example you could have two rows:
 Total Visitors (1000 records) Total Visitors who paid by credit card (250 records)
If you applied a ratio to these rows, you would see a value showing how many visitors paid by credit card out of all visitors. This would be shown as 4:1. In this example it would mean that 1 visitor out of 4 pays by Credit Card.
Column Total Ratio
This allows you to apply a ratio for the columns of your table. Column Sub Total Ratio
As above except the ratio can be applied to column subtotals. Time Measure
Formats values in seconds as time.
Example: 85152 seconds become 22:55:12.
- Value Format (drop-down list): Select specific integer, decimal and date formats

On the bottom of the tab there are the following buttons:
- Copy: It allows you to duplicate a total. This can be useful for quickly copying over configurations between one total to another.
-
New Total:It allows you to add multiple aggregations to a single Crosstab.
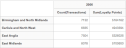
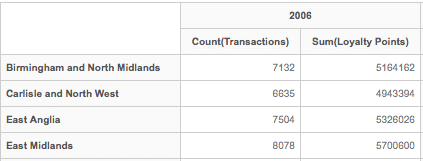
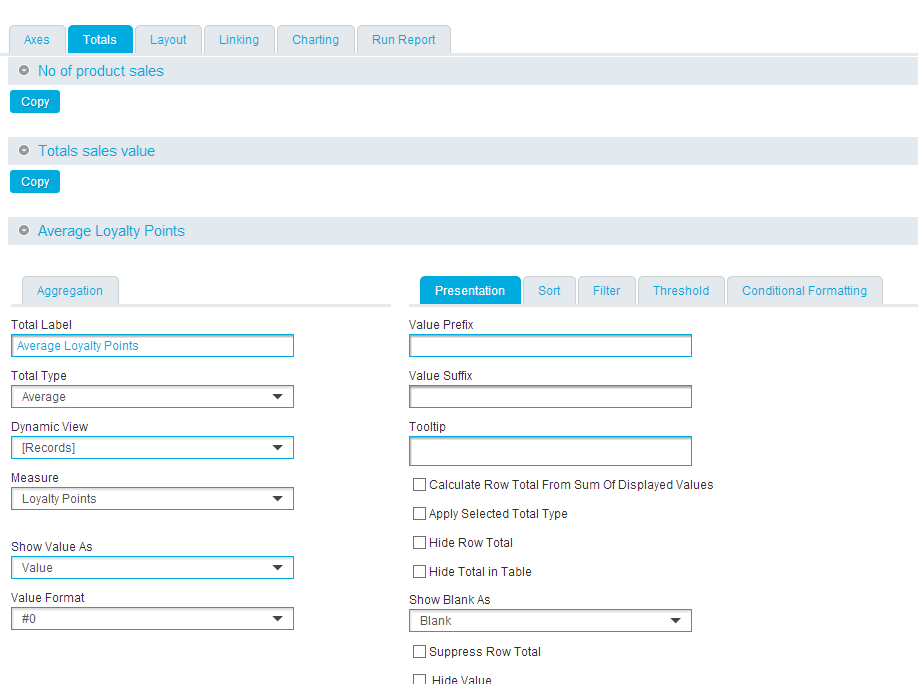
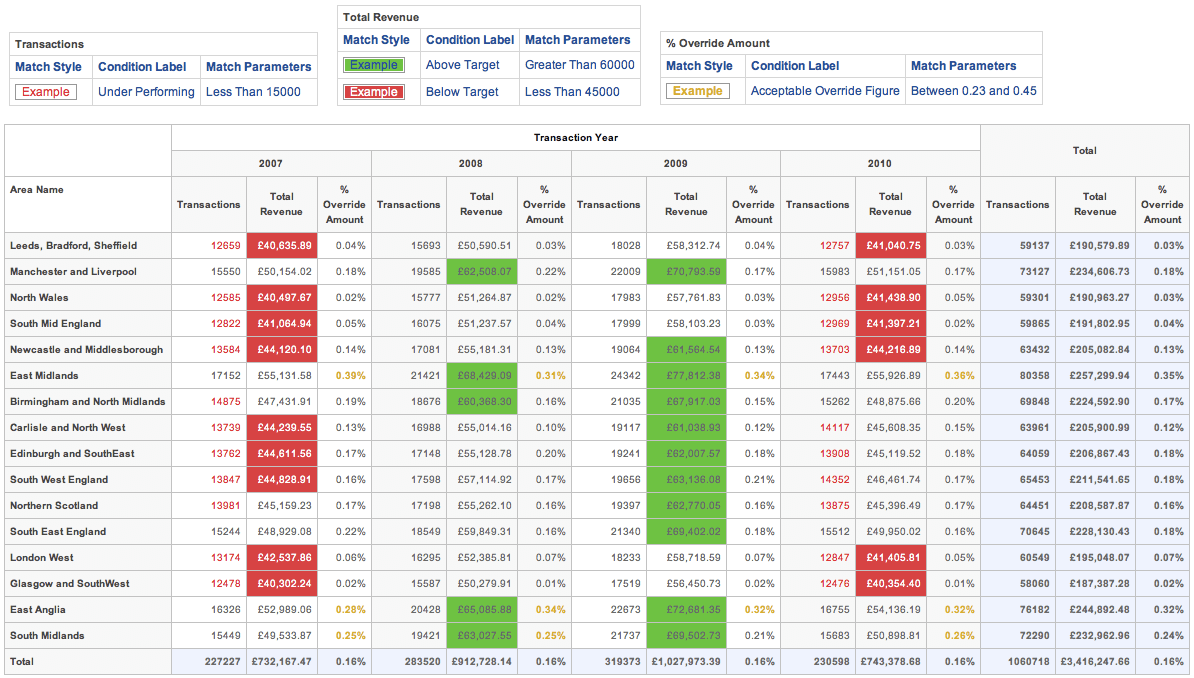
Example
Example: Using retail data you could opt to see a COUNT of all Products Sold, the SUM of the values of all sales and the AVERAGE Loyalty Points earned by each customer for all Areas and Months of the year. The configuration of the Crosstab would then look like:

Presentation tab
Once the aggregation options have been set, there are multiple options for customising how results are displayed:
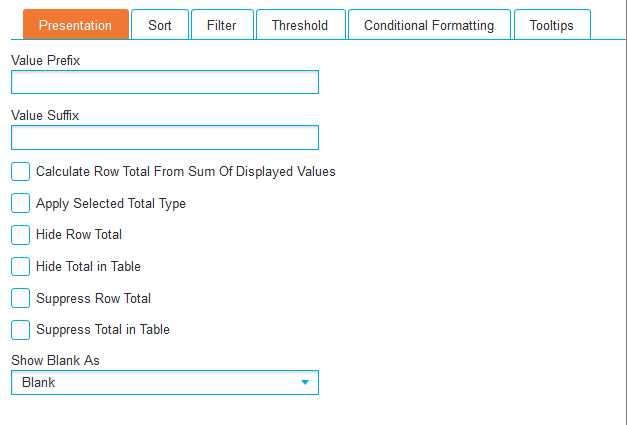
- Value Prefix/Suffix: Type some text to be added as a prefix/suffix to the values shown in the table, such as £, $, €. These options do not apply to row totals.
- Calculate Row Total From Sum of Displayed Values (checkbox): By default, totals using dynamic views show the distinct count for the row or column specified in the dynamic view, not the total of all of the cells shown. By selecting this option, all displayed values will also be summed. This is especially useful when, for example, filtering to a ‘Top Ten’ type report. When enabled, the total of all values is displayed rather than just the top ten. This allows the same data to be displayed in different ways depending on the reporting requirements.
- Apply Selected Total Type (checkbox): This option forces the row or column to perform the Total Type aggregation on displayed values rather than on the underlying data.
- Hide Row Total (checkbox): Hiding specific totals will depend on how the Crosstab is configured. To hide the total for an individual measure, check this option. This is only relevant if there are both rows and columns added to the Crosstab. If there are no columns, all totals are classed as row totals.
- Hide Total In Table (checkbox): Enabling this hides any total created in the 'Totals' tab.
- Suppress Row Total (checkbox): Enabling this removes row totals for Crosstabs with multiple rows. Subtotals are still displayed.
- Suppress Total in Table (checkbox): To hide the actual value, use this option. This is useful when used in conjunction with conditional formatting to provide only a colour or image when conditions are met.
- Show Blank As (drop-down list): It allows the customisation of how blank totals are displayed.
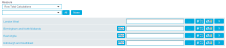
Row Calculations tab
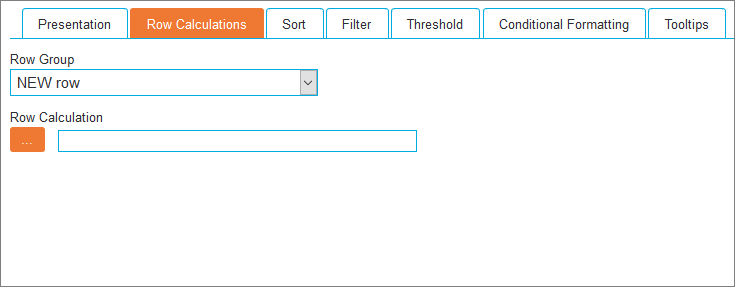
This tab will only appear if a placeholder row, without any logic attached, has been created. Row calculations allow calculations between the rows added to the Crosstab.
|
Select the newly created placeholder on the Row Group drop-down list and click the ellipsis (…) icon under Row Calculation label to open the Calculation Builder, where the row calculations can be entered.
Sort tab
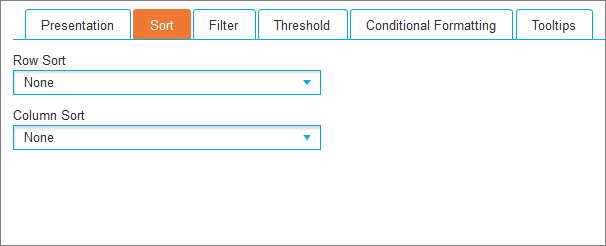
This tab allows rows and columns to be sorted either ascending or descending using the Row Sort and Column Sort options. The sorting is applied in a hierarchical structure when nested rows or columns are used.
Filter tab
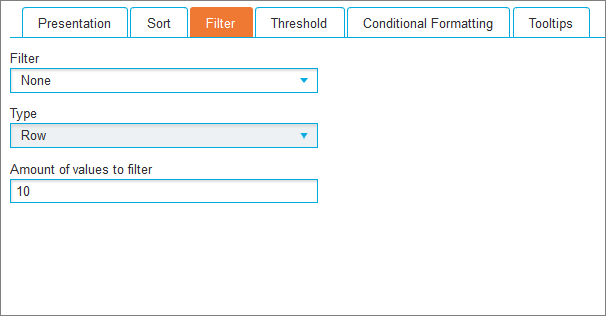
This tab allows you to specify the number of highest or lowest results or percentage contained within row totals, column totals or cell values.
- Filter (drop-down list): Select a portion of the data
- Type (drop-down list) : Select Row, Column or Cell filtering
- Amount of Values to Filter: Enter the required number of values
Threshold tab
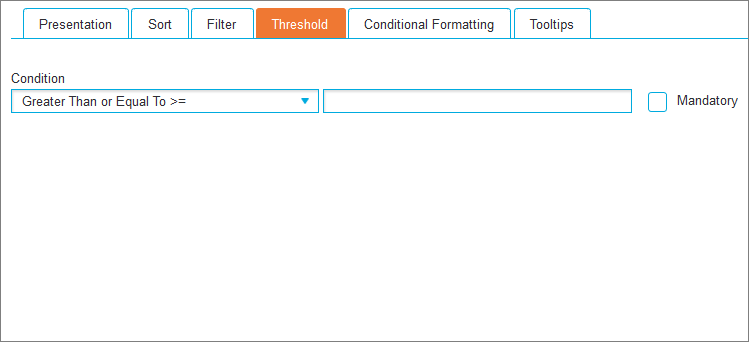
This tab allows the search results to be narrowed down to only those that meet a specified condition.
- Condition (drop-down list): Select the required condition and complete the equation in the following textbox(es).
- Mandatory (checkbox): When there are multiple thresholds contained within the Crosstab this option ensures the results meet the specified conditions.
Conditional Formatting tab
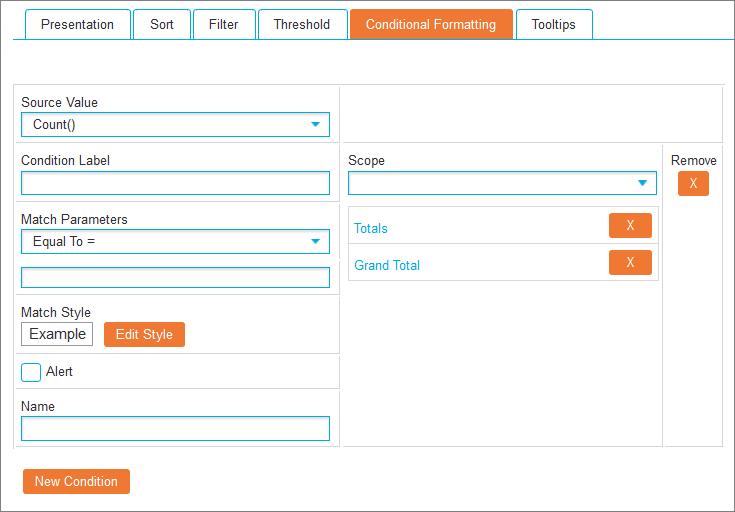
This tab allows the setup of specific formatting to table cells when customisable conditions are met.
Note: When using themes, you cannot set a background colour in Conditional Formatting.
Click New Condition to reveal the options:
- Source Value (drop-down list): Add a condition based on the values from a different total. The default value is the total under edit.
- Condition Label: Type a label if required (appearing only to the conditional formatting legends in the header or footer of the Crosstab).
- Scope (drop-down list): Select one or more options to restrict the formatting to certain totals.
- Match Parameters (drop-down list): Define the parameters that will invoke the conditional format and complete the numerical equation in the textbox(es) below.
-
Match Style: Displays a visual clue on how the current settings will display a total when it matches the parameters set. Click Edit Style to open a pop-up window for customising the formatting.
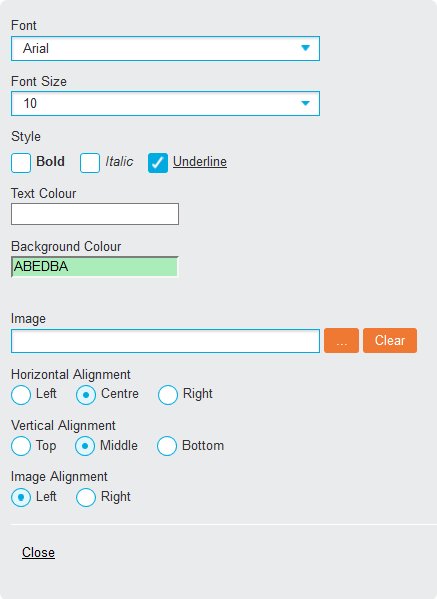
Edit Style parameters

- Font: The font to be used
- Font Size: Specify the size of the font
- Style: Select Bold, Italic and/or Underline
- Text/Background Colour: Select a colour from the pop-up box or type its hex code
- Image: Click the ellipsis (…) icon to specify an image file to be displayed. To remove the image, click the Clear button.
- Horizontal Alignment: Select Left, Centre or Right
- Vertical Alignment: Select Top, Middle or Bottom
- Image Alignment: Select Left or Right
Click Close to save your changes and close the pop-up window.
- Alert (checkbox): This option allows you to set alerts that can be used to drive whether a report schedule is or is not sent, based on whether the condition is met.
- Name: Enter the required title for the alert.
Clicking the New Condition again allows to setup additional formatting sets of rules.
Click the X button to remove a formatting set.
Tooltips tab
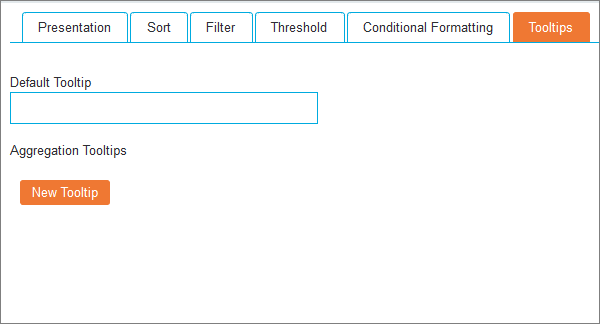
Tooltips allow customisable text to appear when the cursor hovers over a particular total, giving end users more information if required.
Enter the desired text in the Default Tooltip textbox. To create individual tooltips for each aggregation, click the New Tooltip button under the 'Aggregation Tooltips' label as many times as needed.
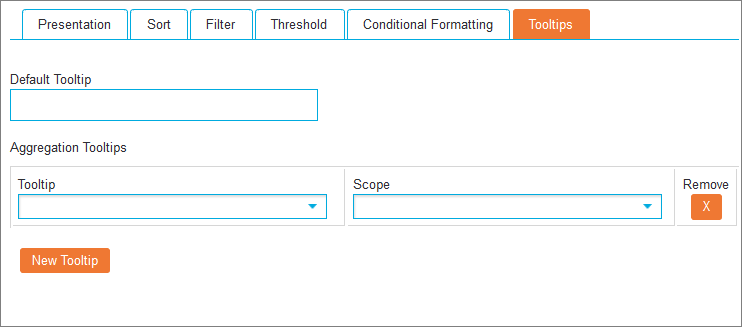
Select the function using the Tooltip drop-down list and the total types that it will apply to using the Scope drop-down list. To remove a Scope selection, click the X icon next to it.
Linking tab
Note: This tab will only appear if the Drill Through to Records option in the main Linking tab is removed.
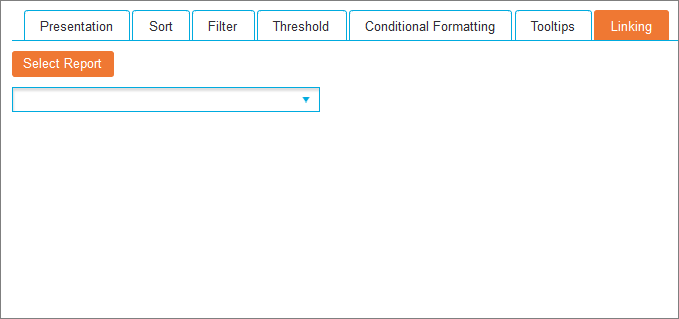
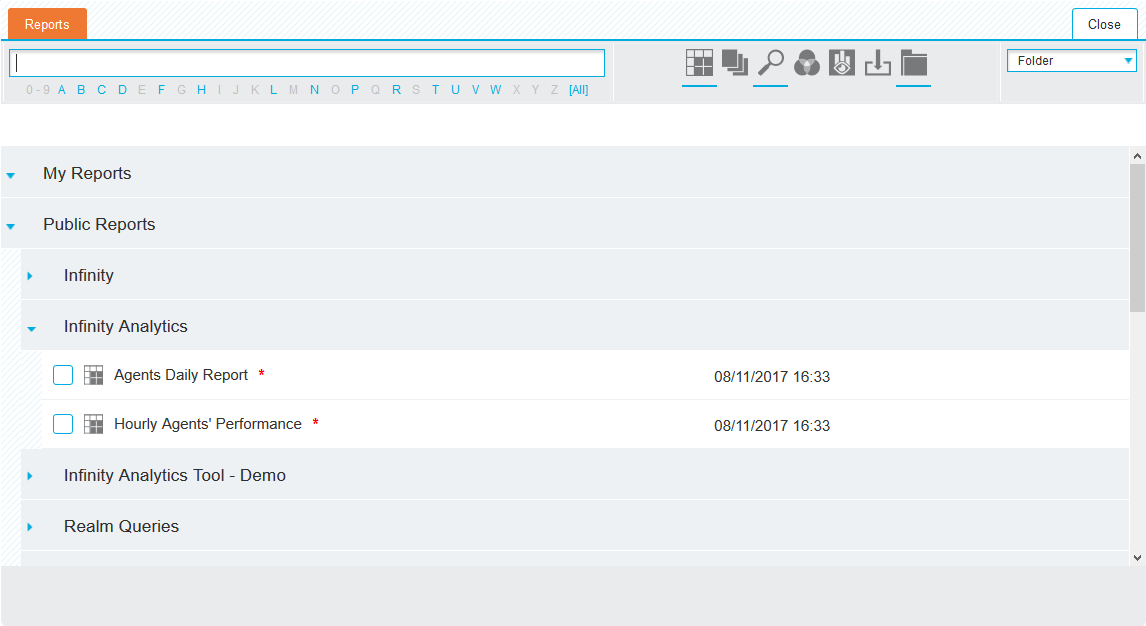
In this tab you can set different totals to drill down to different reports. Click Select Report to open the saved reports window and click the checkbox(es) next to the desired report(s) to be linked.
To remove a linked report, either uncheck it from the drop-down list or click the X icon next to the relevant report.