Venn Diagrams
The Venn diagram functionality enables you to quickly and easily build complex search terms by manipulating visual representations of data, known as sets. By positioning the sets so they overlay, relationships can be established to allow a broader understanding of the underlying data. Each set is visually represented by a coloured circle.
To access the Venn diagram functionality, click Venn on the Menu links panel at the top of the screen. Click Load to load an existing Venn diagram.
Click theSave  icon on the menu bar to save your Venn.
Modes
The Venn diagram functionality runs in two distinct modes:
-
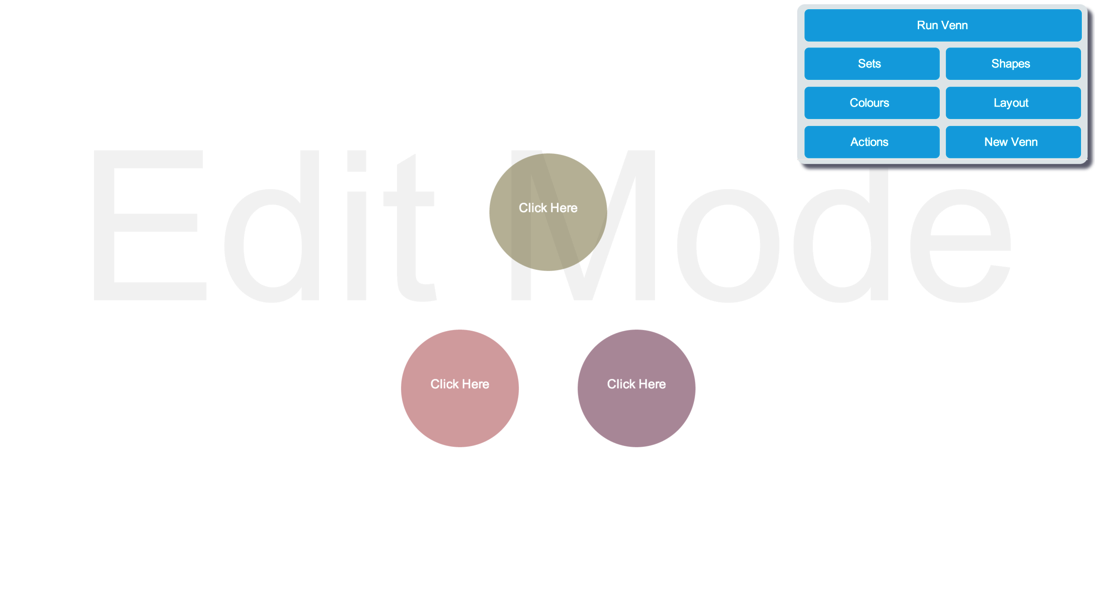
Edit mode (default): In this mode, the sets are configured with the required data.

-
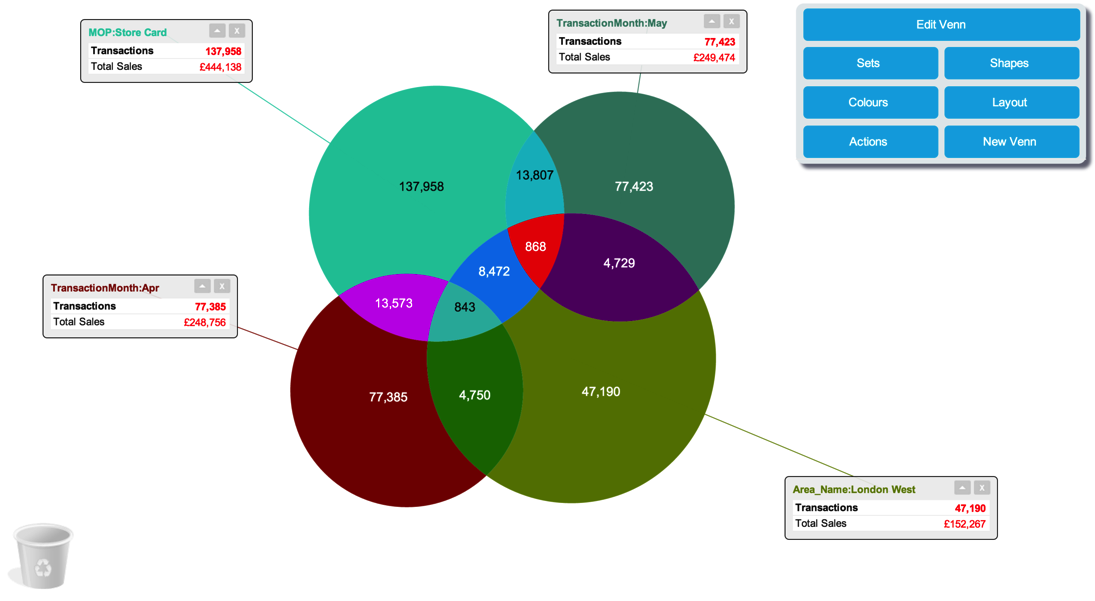
Run mode: This mode allows you to run the Venn.

Control Panel
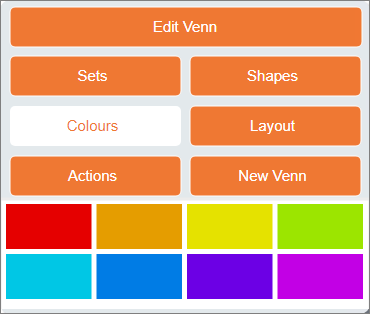
To the right of the canvas there is the Venn control panel.
The following options are available:
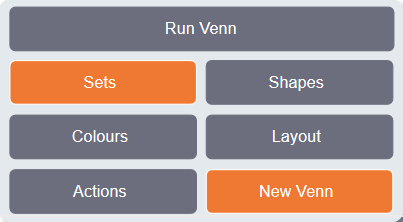
Access the Run mode
Displays tabs with information and options for storing intersections and configuring totals (depending on the current mode)
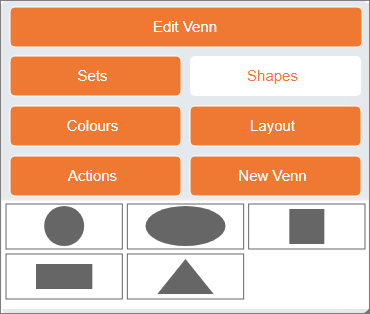
Change the shape of a set. A selection of shapes are available and are applied by dragging the shape selection onto the required set.
Change the colour of a set. A selection of colours are available and are applied by dragging the colour selection onto the required set.
Provides you with a number of options for further customising the appearance of sets.
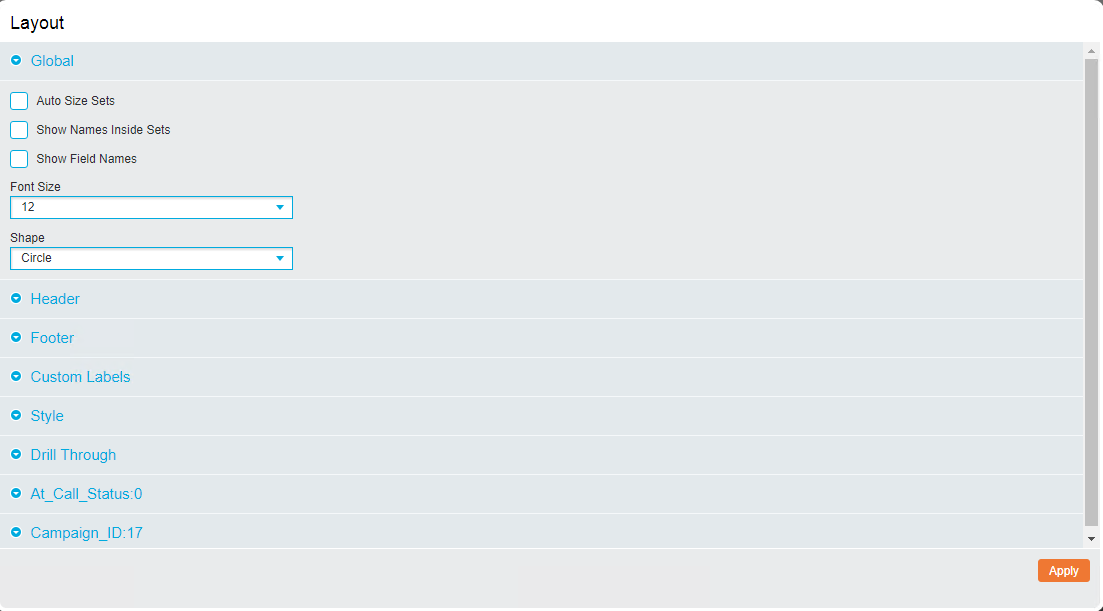
The following options will apply to all sets on the canvas.
- Auto Size Sets: It will proportionally size the sets based on the total that is selected under the 'Measures' tab. This option disables manual sizing of sets.
- Show Names Inside Sets: Displays the details of an intersection inside a set. This provides a means of hiding the label without losing a descriptor of the set.
- Show Field Names: It will prefix the value of sets with the name of the field, especially useful when distinguishing between sets that contain similar values.
- Font Size (drop-down list): Applies a standardised font size across all sets. This only applies to the total in the set and not to the set label.
- Shape (drop-down list): Changes all sets that are currently on the canvas to the same selection. Subsequent sets will continue to be generated using the default circle shape.
Each set (not intersections) can have its colour and shape set on an individual basis. Click the set name on the bottom to expand the individual set options:
- Colour: Specify a custom colour by either typing the hex code or selecting a colour from the pop-up colour picker.
- Shape (drop-down list): Select the predefined shape.
Click the Apply button to save settings changes and return to the Venn screen.
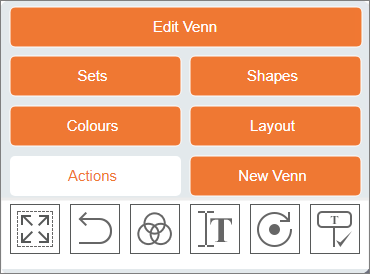
The Actions button provides a number of options for changing the layout during Run mode.
| Icon | Label | Description |
|---|---|---|

|
Apply To All |
When enabled, resizing a single set will result in all sets on the canvas being resized at the same time. |

|
Reset Sets |
Places sets back to their original starting position and original size. |

|
Arrange Sets |
Automatically arranges sets so that they intersect with each other. Any sets that have been resized will be restored to their original size. Note: This action is only available when there are less than 6 sets on the canvas. |

|
Rename Components |
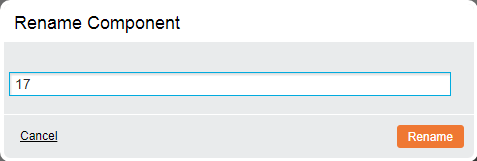
Renames the label of a set. Click this button then click either the label or set to rename it.
On the pop-up dialog box enter a new name and then click the Rename button to complete the process. Note: To rename the base sets (i.e. the whole set) you will need to ensure that they are not intersected with any other set. |

|
Rotate Sets |
Use this option to change the rotation of a set. Once selected, click the desired set and move the mouse towards or away from the set to change the rotation. |

|
Toggle External Labels |
Click this option to hide all external labels from any sets currently visible on the canvas. |
Allows you to clear the canvas and start the Venn building process again.
Venn Intersections
| Set Combination | Action | Search Term |
|---|---|---|
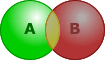
 OR OR  |
Double-clicking Set A | Set A |
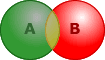
 OR OR  |
Double-clicking Set A | Set A AND NOT Set B |
|
Double-clicking Set B | Set B AND NOT Set A |
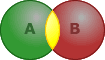
|
Double-clicking the intersection of Set A and Set B | Set A AND Set B |
 OR OR  |
Double-clicking Set B | Set B |