Run mode
This mode is accessed when you click Run Venn on the control panel.
Manage elements
- Move sets or labels: To move a set or label, drag and drop it to the desired position on the canvas.
- Resize sets: To manually resize a set, right-click it and move the mouse left (to shorten it) or right (to grow it up).
- Move sets and labels: To move the canvas to ensure all intersections are kept intact, click anywhere on the canvas and drag it into the required position.
-
Remove sets: To remove a set from the canvas, drag it to the Recycle Bin located at the bottom-left of the canvas.


Drill Through
To drill through to the underlying data, double-click the set or single click the label. This will display the Query screen with the data filtered to show the specified records.
To return to the previous screen, click the Undo  button on the menu bar. Alternatively, clicking Venn on the Menu links panel navigates you back to the previous screen while preserving the resulting query.
Set Information
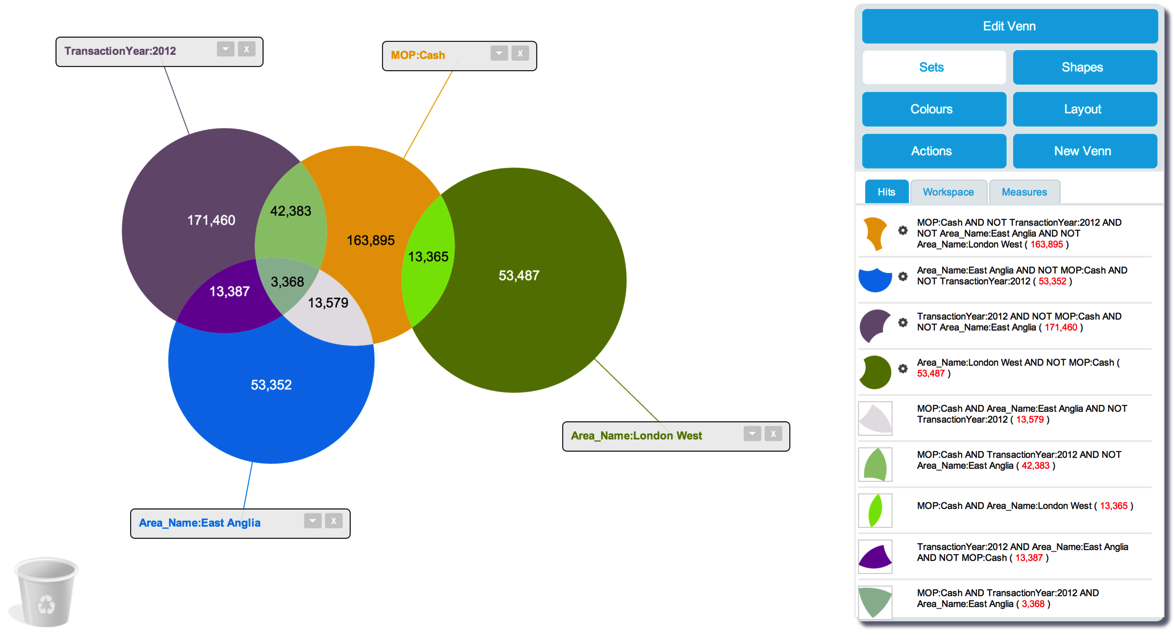
When in Run mode, clicking the Sets button on the control panel provides up to 4 tabs:
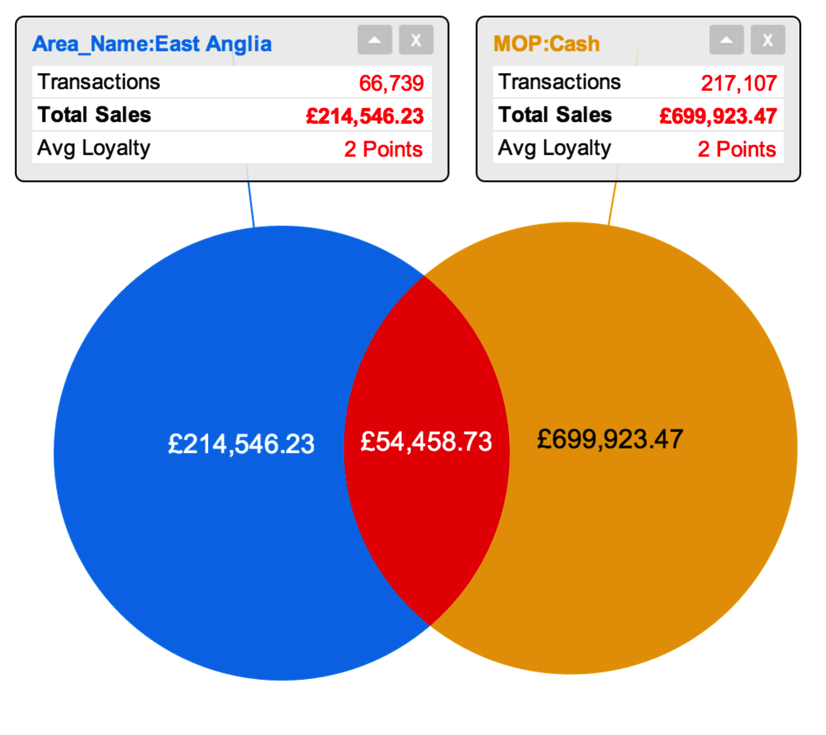
This tab displays detailed information regarding the sets and any intersections, each represented by a scaled image.
Each set and intersection description details its contents along with a count of the records (or whatever total has been selected in the 'Measures' tab). Hovering the mouse cursor over each section highlights the position on the Venn canvas and clicking any of the images toggles the visibility of the associated label.
By default, labels are displayed in a collapsed state.
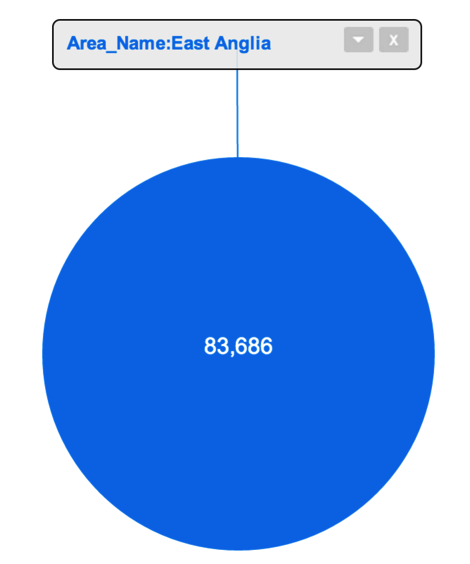
Expand the label by click the down arrow on the label.
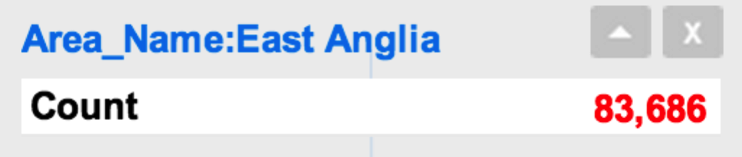
Hide the label using the X icon and show it by clicking the relevant image in the 'Hits' tab. Only totals that have been created in the 'Measures' tab will be displayed on a label. By default, this will just be a count of the rows for the given intersection.
To change the value of a set without entering Edit mode, click the cog  icon next to any individual set to open the Filter Panel.
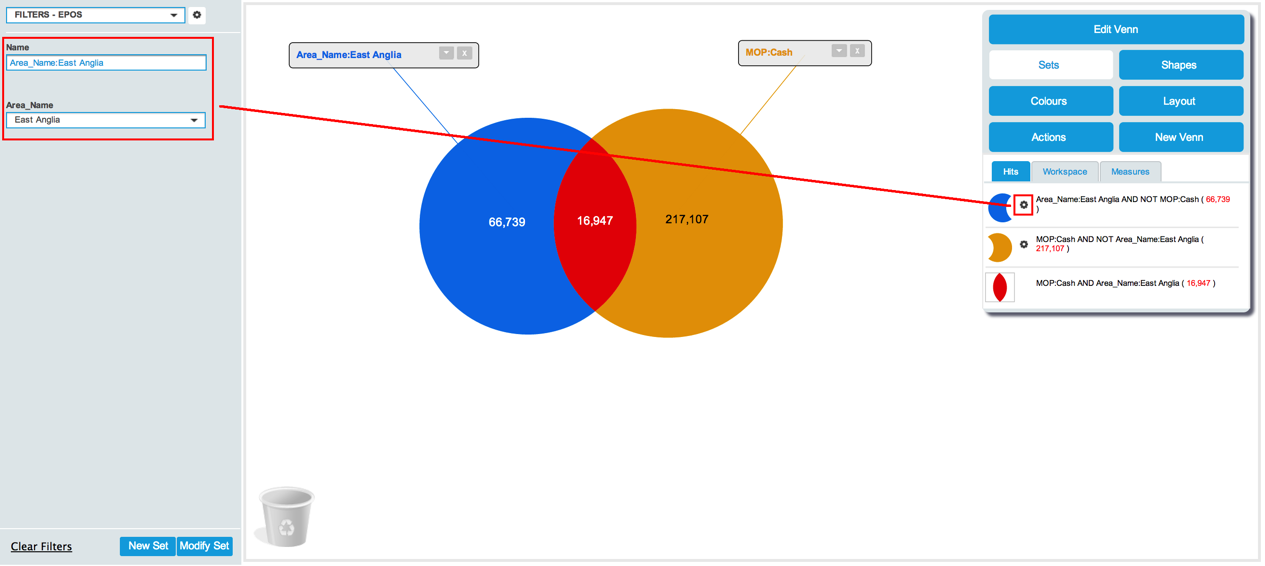
Change the value of the field using the drop-down list and click Modify Set to update the set on the canvas. To modify the field used for the set (or a set of different fields combined as an AND statement), click New Set. This will empty the existing field value and allow the addition of one or more fields to the Filter Panel. Use the Name textbox to customise the name, otherwise a default name will be applied. Configure the field options using the drop-down list and click Add Set to add the new set to the canvas.
Note: This is the only way that the filter panel can interact with Venn diagrams. Standard Analytics filtering techniques do not apply except for when sets are made from saved queries.
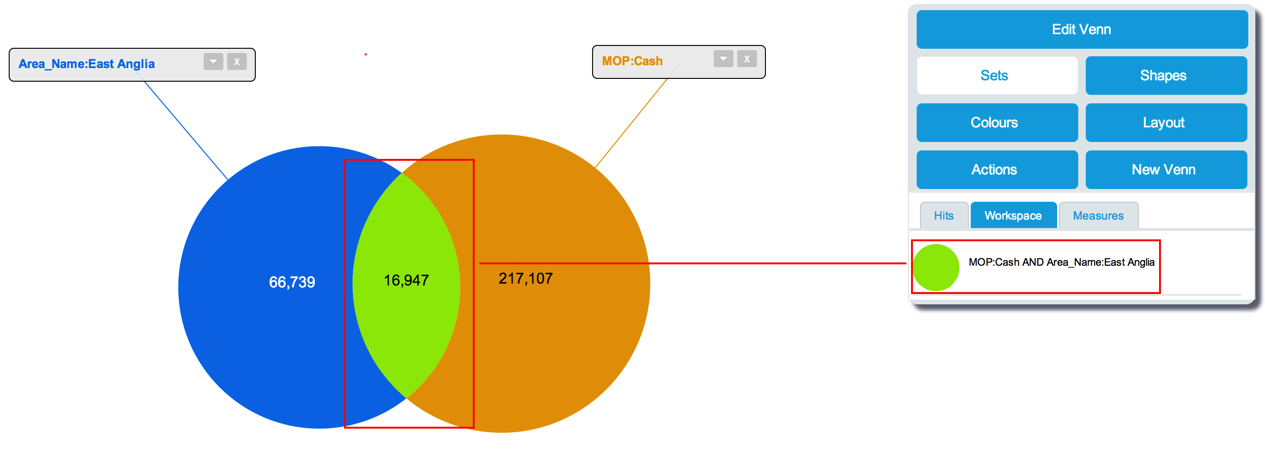
This tab provides the option to store an intersection as a single saved set. This is saved for future reference when the Venn diagram functionality is accessed and is not session dependent.
To add an intersection to the Workspace, drag it into the tab. To remove an intersection, drag it to the Recycle Bin located at the bottom of the canvas or click the red X icon inside the Workspace tab.
Note: When the Workspace tab is selected, the movement of sets around the canvas is disabled. Choose any other tab in the control panel to reactivate this feature.
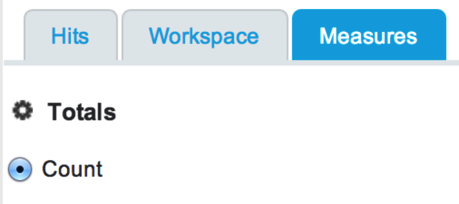
The Measures tab allows the configuration of totals that are displayed in the set labels or over the sets. By default, there will be a single count total for a set when it created.
Clicking the cog icon displays the 'Totals' window.
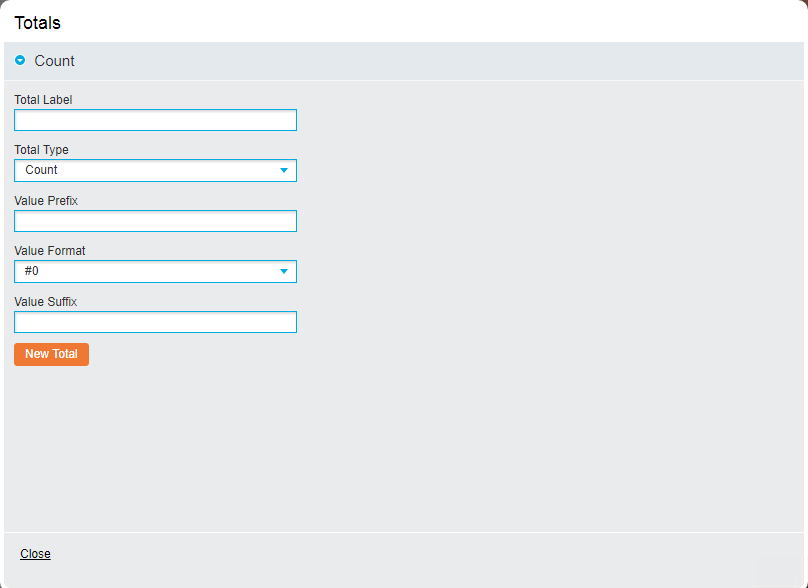
The following fields are available:
- Total Label: The name for the total.
- Total Type (drop-down list): The type of aggregation to be used.
- Value Prefix: A prefix for the total e.g. a currency sign (£, $).
- Value Format (drop-down list): The format of the numeric value.
- Value Suffix: A suffix for the total e.g. %
To amend the existing total, make the required changes and click Close to save changes. To add additional totals, click the New Total button. Use the arrows next to the aggregation name to reorder the totals and delete a total by clicking the X icon.
Upon returning to the 'Measures' tab, all created totals will be displayed in the specified order. To toggle between them select their radio.
The 'Measures' tab also allows Distinct Counts to be applied to sets on the canvas. This provides a count of the unique values for a given set or intersection rather than a count of all values. Use the radio buttons to select a distinct count that will be applied.
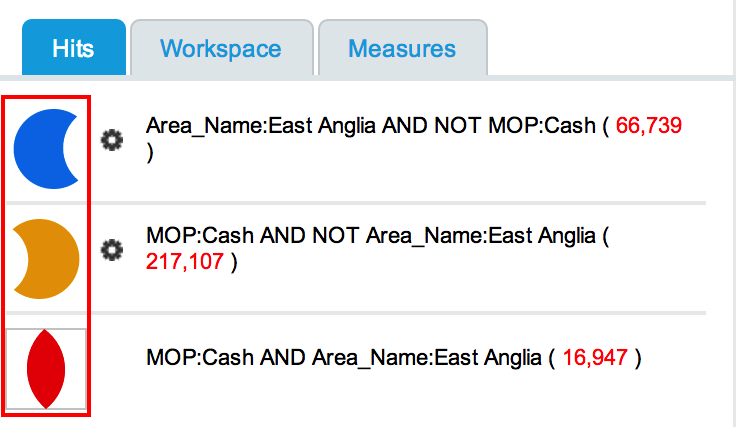
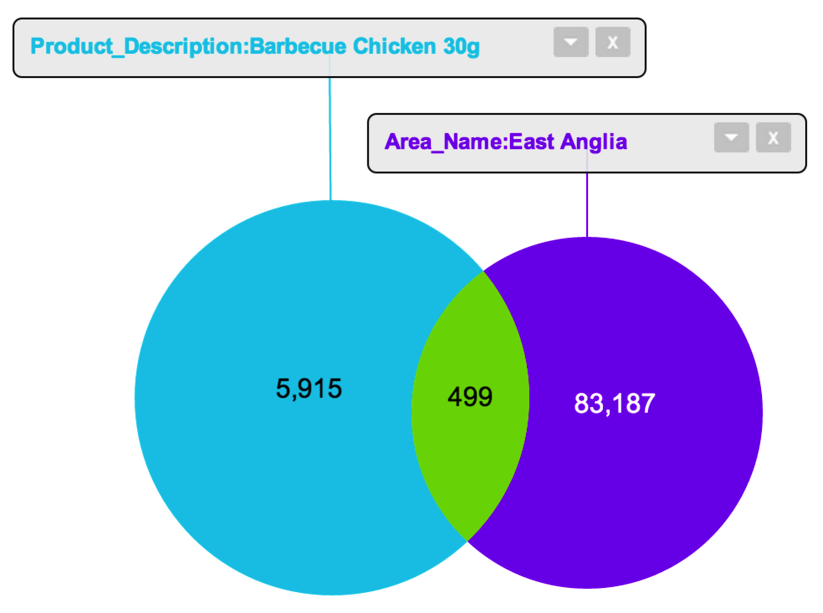
This example shows the number of ‘Barbeque Chicken’ sales that took place in East Anglia. It shows that:
- 5,915 sales happened in areas that are not East Anglia
- 499 sales happened in East Anglia
- 83,187 sales took place in East Anglia for products that were not ‘Barbeque Chicken’
To find out how many employees sold ‘Barbeque Chicken’ you can use a Distinct Count of Employee Name.
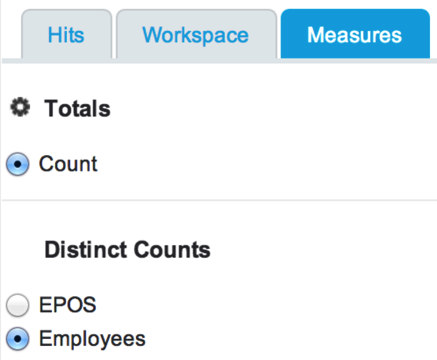
Select the radio button from the list of Distinct Counts and the sets will update to display the data as a distinct count.
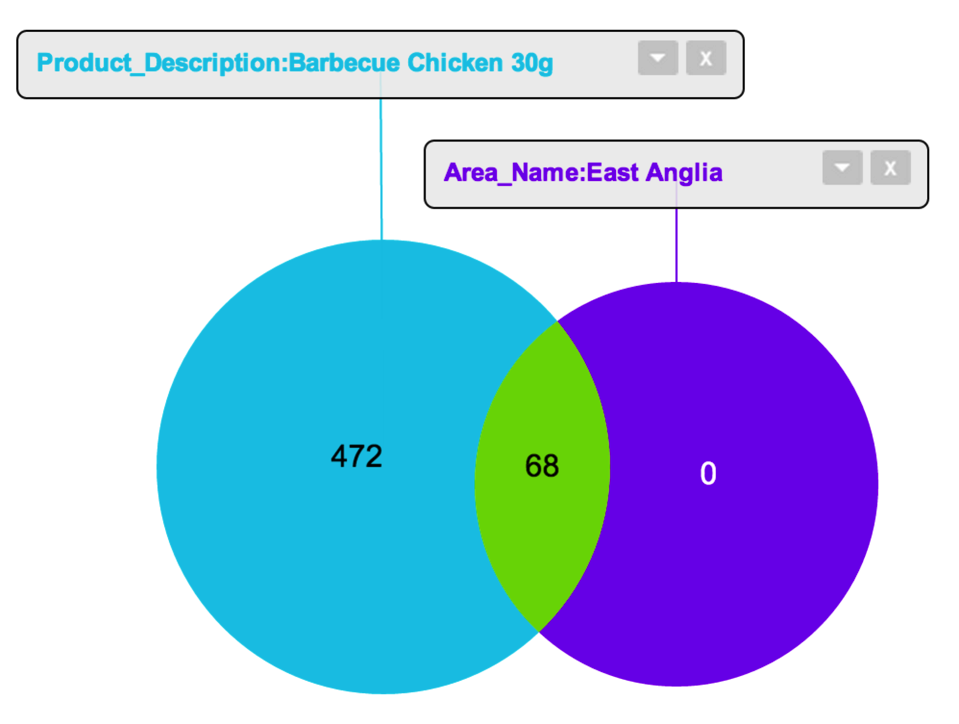
This now shows that:
- 472 different employees sold ‘Barbeque Chicken’ in all areas apart from East Anglia
- 68 different employees sold ‘Barbeque Chicken’ in East Anglia
- 0 employees sold products other than ‘Barbeque Chicken’ in East Anglia
Note: Distinct Counts are only available if the system administrator has created them.
This tab becomes available when more than one instance of the Create Multiple Sets option is used in the 'Create Set' window of the Edit mode. When added, the multiple sets will not be automatically visible on the canvas. By dragging and dropping them from this tab, they can be moved onto the canvas.